
For nonprofit organizations working hard to maintain daily operations, finding extra time in the day to assess your website’s effectiveness can prove difficult. However, in today’s digital world, having a strong online presence can make or break the success of your organization.
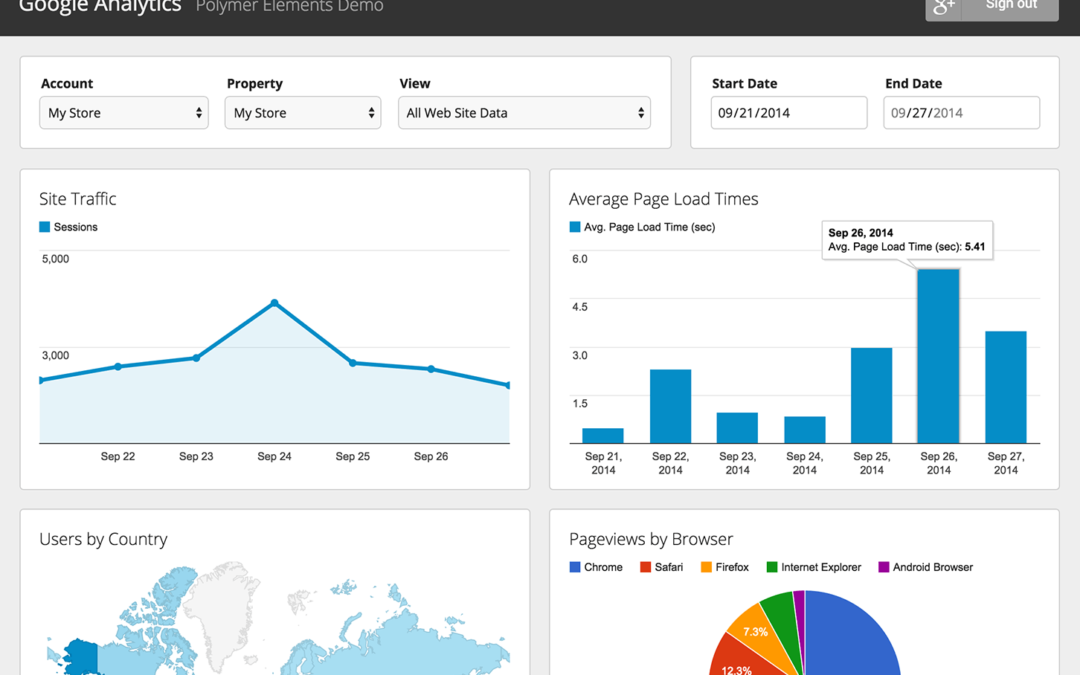
Thankfully, Google Analytics is a free, user-friendly plugin for your website that can help you track all kinds of information about your site, including how many visitors you’re getting, how many of those visitors are new, where they’re coming from, and how long they’re staying on your site.
Regardless of which route you go, Google Analytics can help provide an inside look at your audience and how they like to engage with your organization. Below, we’ll walk you through four reasons why Google Analytics should become an obsession for your organization.
1. Understand Where Your Website Traffic Is Coming From
Confidently knowing how your website visitors find your site can be invaluable in helping determine your content strategy and what your organization is putting out into the online space.
Do most of your visitors find you through social media? Continue your social media strategies and begin testing new strategies. Are your search traffic numbers very low? Then it’s time to work on SEO and keywords in your website to make sure that you can be found on the first page of Google.
Having the data to confidently back up your strategies can help your organization branch out and try new avenues in order to bring traffic to the site. For example, you can write a guest blog post and track how many people visit your site. You can run a traditional ad on a website and see how many users click on the ad.
The possibilities here are almost limitless, but when trying new strategies to reach your audience, always make sure to check Google Analytics to see if those strategies are actually a good way to spend your time and resources.
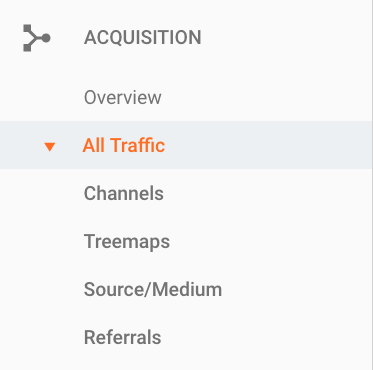
How to access this report: Acquisition > All Traffic > Channels/Source/Referrals
2. Discover Where People Are Leaving Your Site
Several recent studies have proven that, sadly, online users’ attention spans are shorter than that of a goldfish. You have only eight seconds to hook your audience once they land on your site. Even if you’ve spent the time and resources to build a beautiful site, there could be pages that need slight tweaking to ensure your site visitors don’t click away.
There are two types of actions to understand in Google Analytics when it comes to visitors leaving your website: bounce rate and exit rate. Bounce rate is the percentage of users who don’t take any action and leave from the same page on which they landed. Exit rate tracks the percentage of users who exit your site after visiting several pages.
When looking at these reports, see which pages have the highest exit or bounce rate and determine what could be adjusted to allow visitors to interact more with your site. Change copy, add links to similar content, or include a sign-up form to your newsletter.
Also, make sure that your site is visually interesting “above the fold,” meaning that there is engaging content for your audience to see without having to scroll. This can vary depending on your mission and your goals, but it’s always great to show images of your mission in action, tease your latest blog posts or other recent content that reinforces your mission.
You also want a prominent call-to-action guiding the visitor to do what you want them to do next, whether that’s reading more, donating, volunteering, or attending an event. Whatever you do, keep it fresh above the fold. Update that content as often as possible so people see something new every time they come back.
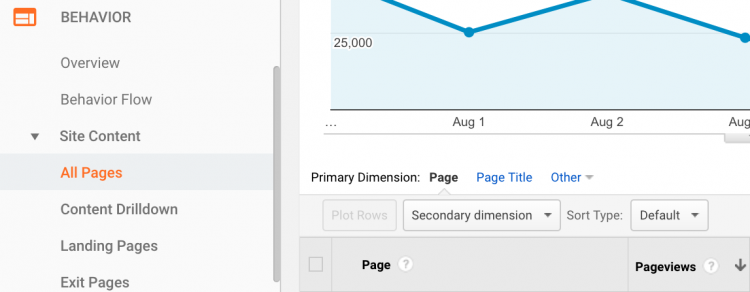
How to access this report: Behavior > Site Content > All Pages

3. Know What Content People Are Reading Most
When planning what content you will be creating (e.g. blog posts, social media posts, free resources, opt-ins, etc.), it is important to know what content is currently performing well on your website. If you have a blog post with a lot of site traffic, perhaps your audience would enjoy similar content or more detailed information on that topic.
One strategy to capitalize on these popular pages, and use them to strengthen your organization’s content strategy, is to include a conversion point for your audience. Make sure that you have a sign-up form for your newsletter or a “Get Involved” button so that your audience knows how they can support your organization.
With Google Analytics, you can identify these highly trafficked posts and make them work beyond just the content they offer.
How to access this report: Behavior > Site Content > All Pages> Sort by highest page views
4. Keep Track of Conversion Rates
Conversion rates don’t necessarily need to be monetarily based (e.g. someone makes a purchase or donates to your organization). According to WordStream, your conversion rate is, “the percentage of visitors to your website that complete a desired goal… out of the total number of visitors.”
Depending on your organization’s goals for a particular webpage, understanding what percentage of your website visitors actually convert to a paying donor, email list member, or event registrant can give you a good idea of the success of your converting methods. Most importantly, understanding your conversion rates can help you determine how much you spend on advertising or paid clicks.
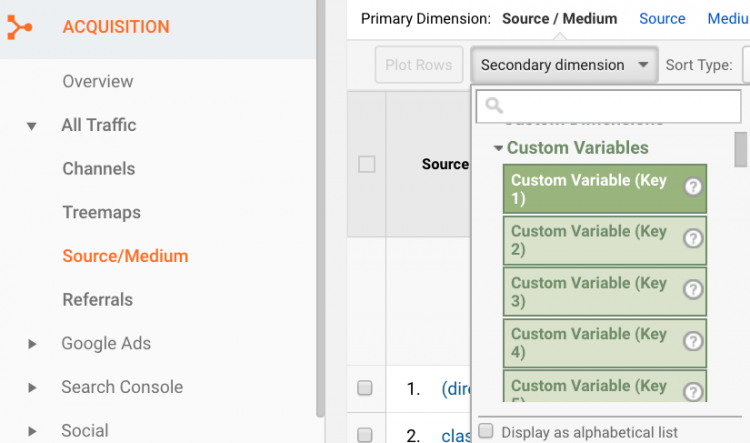
How to access this report: *Set up a goal with the confirmation page for your opt-in. Then visit All Traffic > Source/Medium > Goal Set 1
Now that you know some of the most important reports to run and numbers to keep track of, we recommend checking your Google Analytics reports at least once a week. Getting into this routine will help you make more informed decisions about what content is most effective in bringing visitors to your site and keeping them there. There are people out there who want to know about your organization and its mission, so start obsessing over Google Analytics to make sure they can find your website and join you in your work.


